Welcome to the Neptune Scale docs!

Charts displaying a large number of metrics at once in the Neptune web app

What is Neptune Scale?

Neptune is the most scalable experiment tracker for teams that train foundation models.
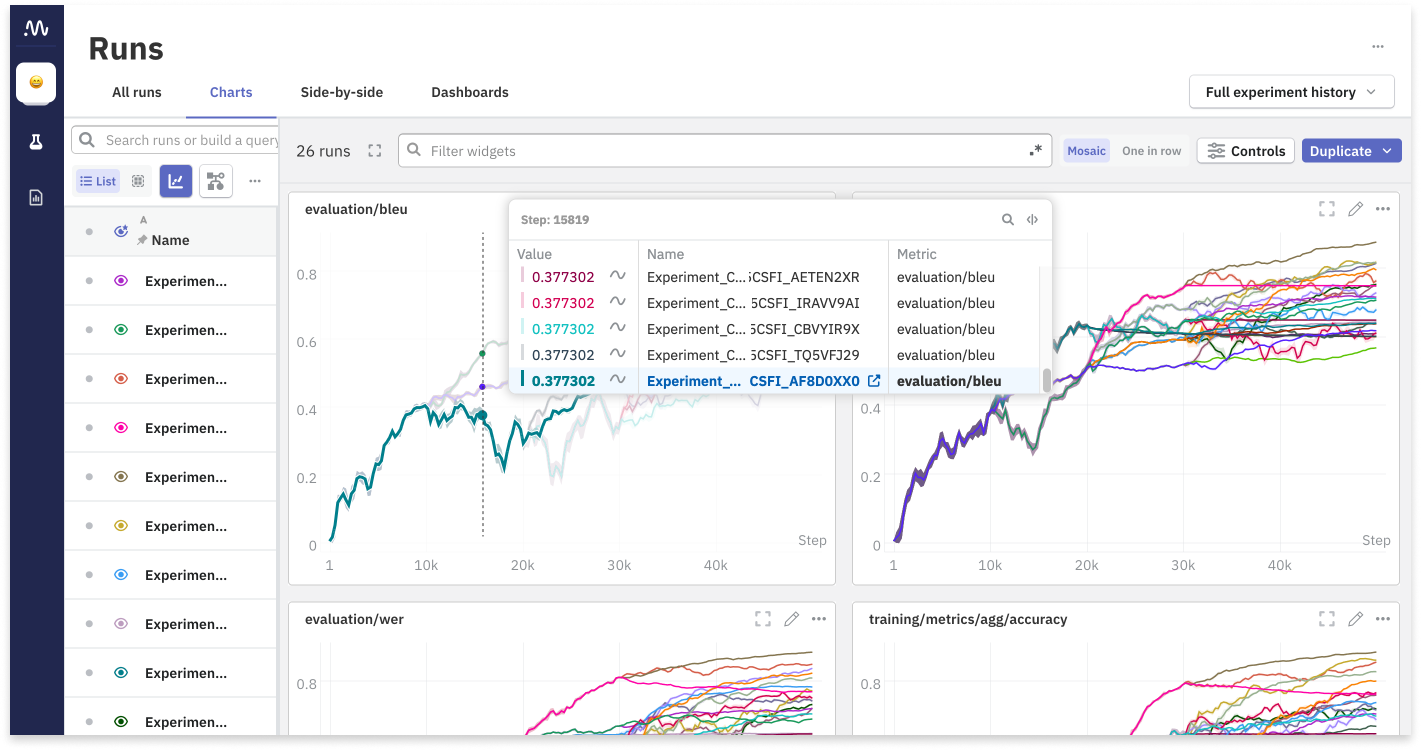
Neptune Scale is the next major version of the application. It's built on an entirely new architecture for ingesting and rendering data, with a focus on responsiveness and accuracy at scale.

  • Experiments: Monitor long model-training experiments with multiple steps and forks.
  • Charts: Visualize and compare thousands of metrics in seconds, with many additional configuration options.
  • Reports: Analyze groups of runs seamlessly, even from different projects.

Differences to Neptune 2.x

Neptune 2.x is the version that is currently available to all customers. Compared to 2.x, Neptune Scale introduces new functionality and streamlined navigation.

Because Neptune Scale is still in closed beta, not all features from 2.x have been ported.

Show available features
FeatureNeptune Scale / 3.x (scale.neptune.ai)Neptune 2.x (app.neptune.ai)
Runs table
Experiment forking and history
Charts tab
Global chart controls
Single chart can show multiple metrics from multiple runs
Custom x axis values
Custom axis expressions
Chart step pre-filter
Side-by-side tab
Dashboards
Widget duplication
Dashboard full or partial duplication
Reports
Report view and edit mode
Report-specific run groups
Multi-project reports
Filter widgets inside report
File logging and preview
Artifact version tracking
Monitoring of system metrics
Logging of source code
Model registry
Project-level metadata
Parallel coordinates

How to get started

If your team has access, see Get started for setup and onboarding.

Neptune Scale is currently available only to select customers. If you don't yet have access, you can:

Changelog

Neptune Scale release highlights. For the full changelogs, follow the links to the release pages.

DateComponentHighlights
Dec 19Web app
Dec 13DocumentationAdded instructions on editing run configs and using regular expressions.
Dec 11Web appYou can use regular expressions to dynamically display metrics on a chart.
Nov 29DocumentationNew how-tos: Run trashing workaround, constructing app URLs, and filtering out Neptune logs.
Nov 28Web app
  • In charts, all graphs that belong to a particular run have the same color. The line style is the same for metrics with the same name.
  • In dashboards and reports, you can duplicate chart widgets.
  • For the chart smoothing algorithm, we replaced the low pass filter with a simple moving average.
Nov 26Python client 0.8.0Added create_project() function. Added NEPTUNE_SKIP_NON_FINITE_METRICS environment variable.
Nov 25Python fetching client 0.9.2Added NEPTUNE_VERIFY_SSL environment variable.
Nov 11DocumentationPublished tutorial for using Neptune Scale in HPO jobs. Documented system namespace.
Nov 6Web app
  • You can include runs from different projects in a single report.
  • Global and local chart controls are revamped. Global controls include options to reset the smoothing and display each run group as a single graph.
Nov 6DocumentationUpdated smoothing page. Described how to combine filters when constructing NQL queries, and how to set a custom timestamp when logging metrics.
Nov 5Python fetching client 0.9.1
Nov 5DocumentationAdded Run API reference.
Oct 29Web app
  • Previously, when an experiment was forked into a new run, the experiment name was removed from the old run's sys/name attribute. Now, the experiment name remains in the sys/name attribute and Neptune instead marks the latest run of an experiment with the sys/experiment/is_head Boolean attribute.
  • In the Charts tab, Global settings were renamed to Controls and include more options: apply smoothing to charts and configure the X-axis scale and range.
  • Added an option to configure the X-axis range in a chart widget.
Oct 28Python client 0.7.1Removed family from run initialization parameters. It was redundant, so you can safely delete this argument from your code.
Oct 23Python client 0.6.3For the log_metrics() method, the data and step arguments are mandatory and reordered. If you passed them positionally, update your code to have the data value first. If you pass the arguments using keywords (data=...), no change is needed.
Oct 21Web app
  • You can switch between workspaces from the user menu.
  • In reports and dashboards, Global settings were renamed to Controls and include an option to apply smoothing to charts. An option to configure Y-axis scale globally is no longer available.
  • Fixed an issue where using keyboard shortcuts to switch the browser tabs resulted in switching tabs in the Neptune app instead.
Oct 14Web app
  • New global charts setting: Step range filter.
  • New chart export options: Choose whether to export all or selected widgets, to a new or existing dashboard or report.
  • Redesigned menu for switching between projects and accessing their settings.
Oct 8DocumentationAdded instructions for fetching metadata via API.
Oct 4Web app
  • To filter widgets in the Charts tab, you can use multiple regular expressions. When hovering over charts, the legend sticks to the cursor until you left click.
  • When adding a widget to a report section, it's added to the bottom instead of the top.
  • In the experiments table, you can choose to display only runs selected for compare mode.
Sep 25DocumentationAdded quickstart and Neptune Query Language reference.
Sep 18Web appIn reports, widget creation is streamlined and you can have run groups pinned to the bottom. In charts, you can set custom X-axis expressions.