Dashboards in Neptune
A dashboard is a customizable display option for runs in your project. Dashboards are like a lens or template that applies to whichever runs are visible, which lets you quickly analyze your latest experiments and see the most relevant metadata at a glance.
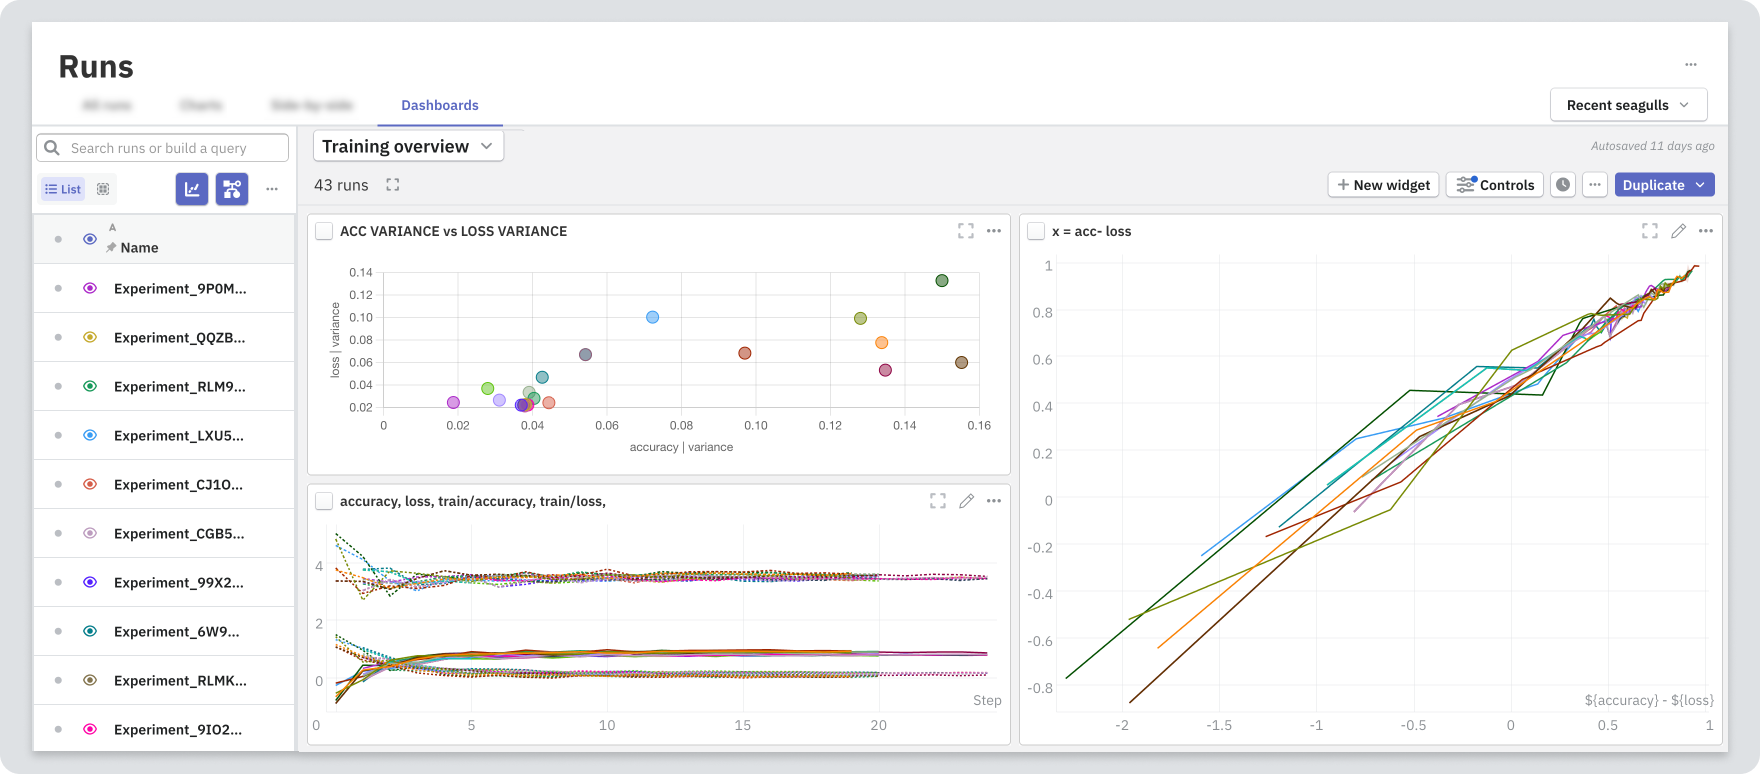
You can combine different metadata types, for example:
- Overlaid metrics and loss for training and validation, on the same chart.
- Model parameters and other configuration values.
- Relationships between configs, metrics or aggregates as a scatter plot.
The dashboard displays runs that are selected with the eye icon ().
Dashboard or report?
Both dashboards and reports help you analyze runs and their metadata through detailed and customizable views. Choose which one better answers your needs:
Dashboard
- Ideal for analyzing the ongoing experiments.
- You can compare experiments within one project.
- Dashboard configuration applies to the runs that are currently made visible by a person viewing the dashboard.
Report
- Ideal for analyzing the final results of experiments.
- You can compare experiments from multiple projects.
- You can select visible runs for people who view the report.
- You can add comments and extra resources such as links or images.
Create a dashboard
In the Runs section:
-
Navigate to Dashboards and select New Dashboard.
If there are existing dashboards, expand the dropdown menu and then select New Dashboard.
-
Enter a title for your dashboard.
-
Click New widget and choose a widget type.
For supported types, see Widgets and supported attribute types.
If you resize or reposition the widgets, the layout is saved as part of the dashboard configuration.
Selecting runs to compare
To select runs, in the left table pane, click the eye icons ().
To access display shortcuts, click the eye icon () on the header row.
Chart configuration
Apart from customizing each chart individually, you can configure settings to apply across all charts in the dashboard. Use Controls in the top toolbar to modify the following:
- Apply smoothing
- Change axis settings
- Change X-axis values
- Filter displayed data based on step
Note that the changes you make are saved automatically and visible to everyone who views the dashboard.
Versioning
Dashboards are autosaved when you make a change.
You can access the version history through the button. Click on a version to preview the dashboard in read-only mode.
To edit share or manage a version, access the options ().
Supported widgets
The following table shows the data types that each widget supports:
| Widget | Metadata type | Neptune attribute type |
|---|---|---|
| Chart | Numerical series (metrics, loss, accuracy) | FloatSeries |
| Scatter plot | Numerical or datetime values | |
| Single value | Configs, scores, timestamps |
Exporting to report
You can export a dashboard together with particular runs as a report. This way, you can share and return to the analysis of a particular set of runs later.
-
Navigate to a dashboard and choose which runs to visualize ().
-
Select Duplicate → New report or Existing report.
If you have an unpublished draft of an existing report, you have two options:
- overwrite the draft with the selected widgets
- add the selected widgets to the ones already in the report draft
-
To use the currently visible runs for the report, check the corresponding box.
-
To use the current table configuration, check the corresponding box.
You can modify the visible runs later, while viewing or editing the report.