Parallel coordinates
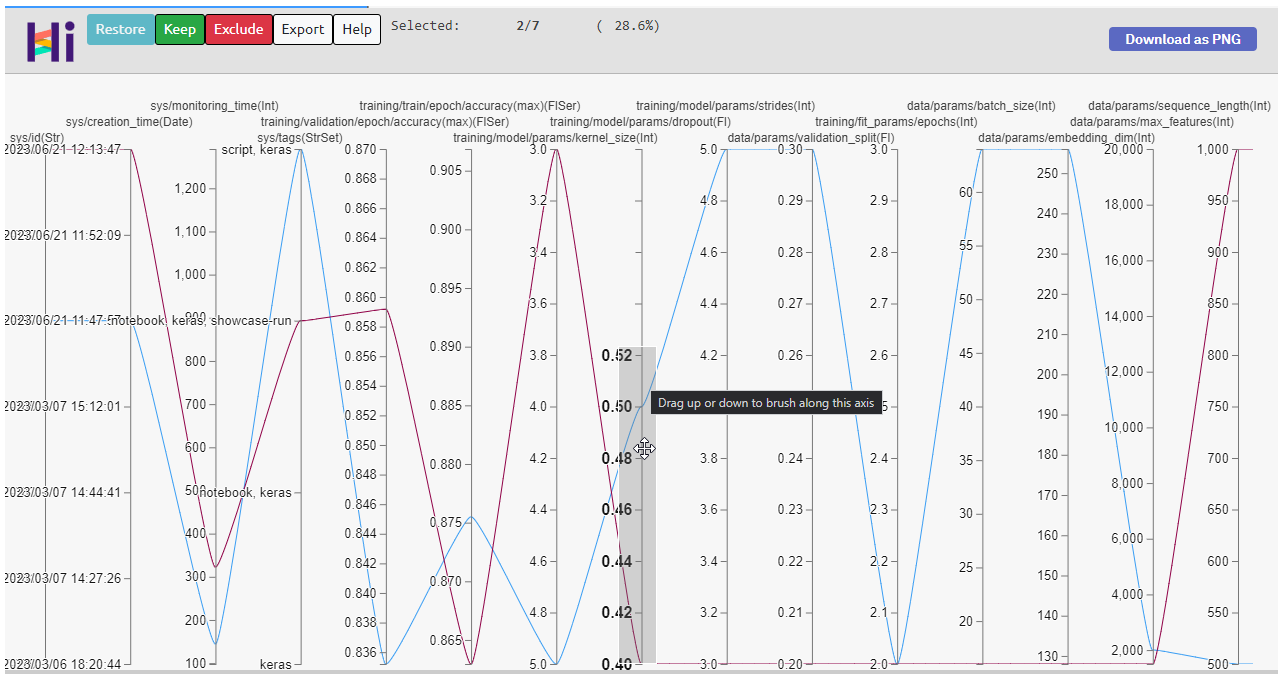
The parallel coordinates view is built with the HiPlot visualization tool.
You can use it to:
- See how model parameters affect the metrics.
- Explore different parameter and metric ranges by selecting a range of a metric or a parameter of interest.
- Download the comparison as CSV or PNG.
To set up your runs for parallel coordinates analysis:
- Navigate to the All runs tab.
- Make sure that the attributes you want to display are added as columns.
- To show runs in compare mode, toggle the eye icons ().
- Navigate to the Parallel coordinates tab.
The plot shows values that are different between the visible runs. You can select a range of values and move the selection around to trace the values' relationship with other metrics.