Create a dashboard#
A dashboard is a customizable display option for each run in your project.
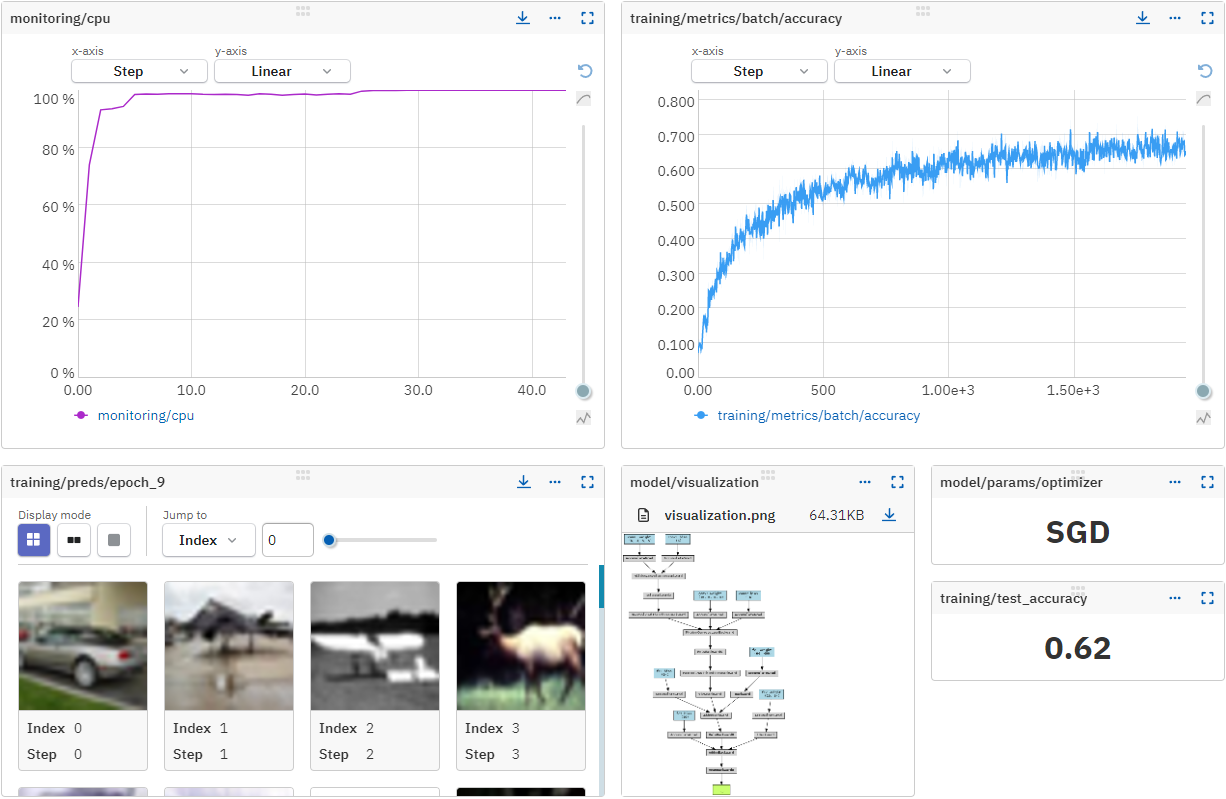
You can combine different metadata types in a single dashboard, such as charts, parameters, image series, and code snapshots. For example:
- Overlaid metrics and loss for training and validation
- Model parameters, training code, hardware consumption, and ROC curves
- Validation metrics and image predictions on a subset of a validation set next to each other
See example dashboard in Neptune
To create a custom dashboard:
- Open a run in Neptune.
- Click New dashboard.
- Enter a title for your dashboard.
-
In the top-right corner, click Add widget.
- Type in the field you want to display and see which widget options you have.
-
Or choose a widget type directly, then enter fields to include.
For an overview of widgets available for each metadata type, see Widgets and supported field types.
-
Enter a widget title.
- Add more widgets to your dashboard as needed.
- Drag and resize the widgets to arrange them to your liking.
- To finish, save your dashboard.
Varying screen size
If you use the dashboard on screens of different sizes, save your dashboard again once you've rearranged the widgets for a particular screen size.
Neptune will remember the configurations as the screen size changes.
Getting more space#
Tip
To enlarge the metadata area, you can:
- Minimize the left sidebar with the button.
- Collapse the toolbar with the icon.
- Adjust the number of table columns shown by unpinning them or dragging to minimize the table area.
- Enter distraction-free mode with the button, to temporarily maximize the metadata area.